Intelligence for the people who run the restaurant industry.
FSRI tracks 1,840 operator menus, 4,200 consumer panelists, and the supplier signals shaping foodservice. Built for executives, analysts, and operators who need to see the cycle before it turns.
Foodservice Industry Outlook 2026: Where the Growth Is Hiding
FSRI's flagship outlook for executives, operators, and investors navigating the year ahead.
Emerging menu trends shaping the next 90 days
Tracked across 1,840 operator menus. Updated weekly by FSRI's menu intelligence desk.
All menu trends →How America eats in 2026
Frequency is flat. Ticket is up 6.8%. Specialty beverage drove 38% of incremental dollars. Five shifts every operator should price into the back half of the year.
- ▌38% of incremental ticket from specialty beverages
- ▌Dining frequency flat; ticket up +6.8%
- ▌Loyalty members visit 2.4× more often
The stack that actually pays back
54% of multi-unit operators are consolidating vendors. 31% killed an AI pilot in the last 90 days. The reference stack converging across the industry, and what it leaves out.
- ▌54% of operators consolidating tech vendors
- ▌31% cancelled an AI pilot in 90 days
- ▌POS + loyalty emerging as the baseline stack
Where the growth is hiding in 2026
Greenville, Boise, Knoxville and Lehigh Valley outpacing national traffic by 3–6 points.
The fastest-growing line item across every segment — 38% of incremental ticket dollars.
1,940 sq ft is the new prototype average. Walk-up and pickup-only formats unlocking new real estate.
27% of adults now plant-forward. Treat it as a sourcing strategy, not a marketing label.
Members visit 2.4× more often and tolerate 5.1% higher prices than non-members.
First quarter in five that native-app ordering gained share against third-party delivery.
Published this quarter
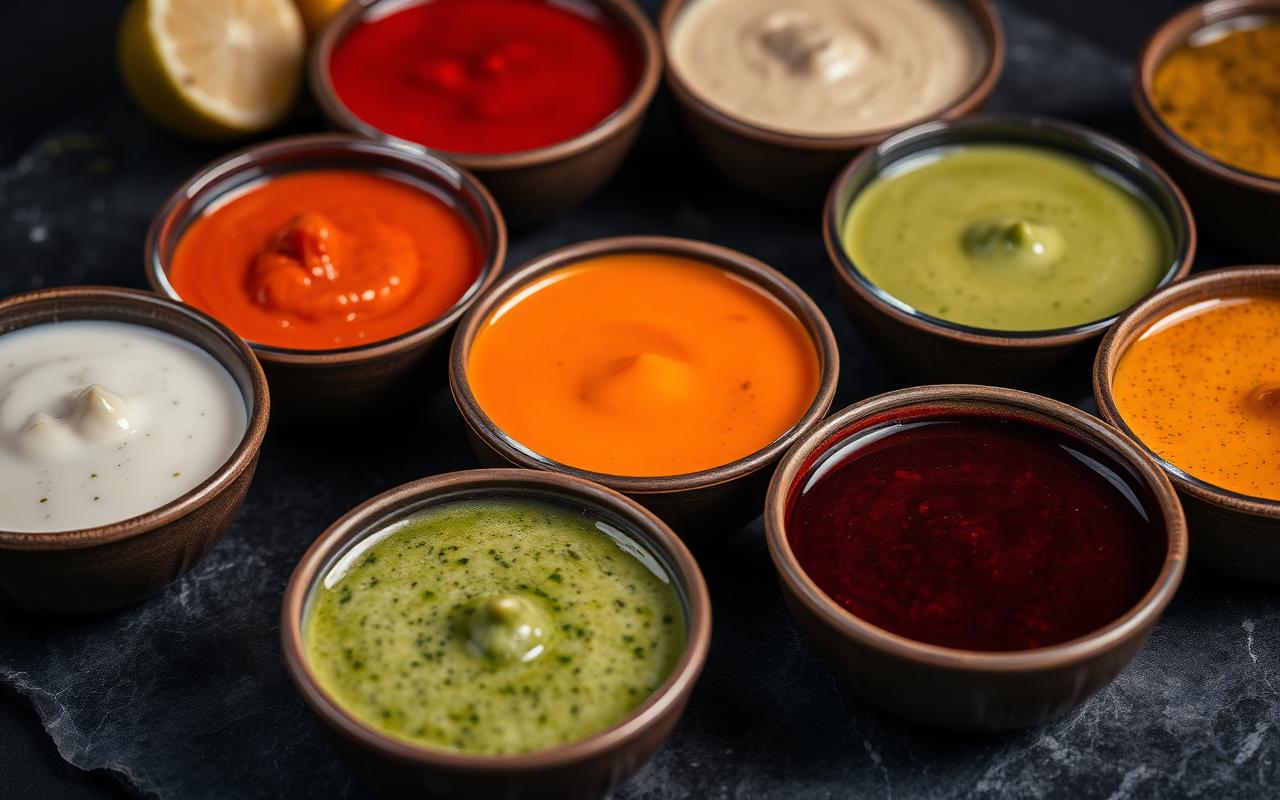
- Menu InnovationEmerging Sauces Shaping Modern Menus in 2026February 12, 2026 · 11 min read→
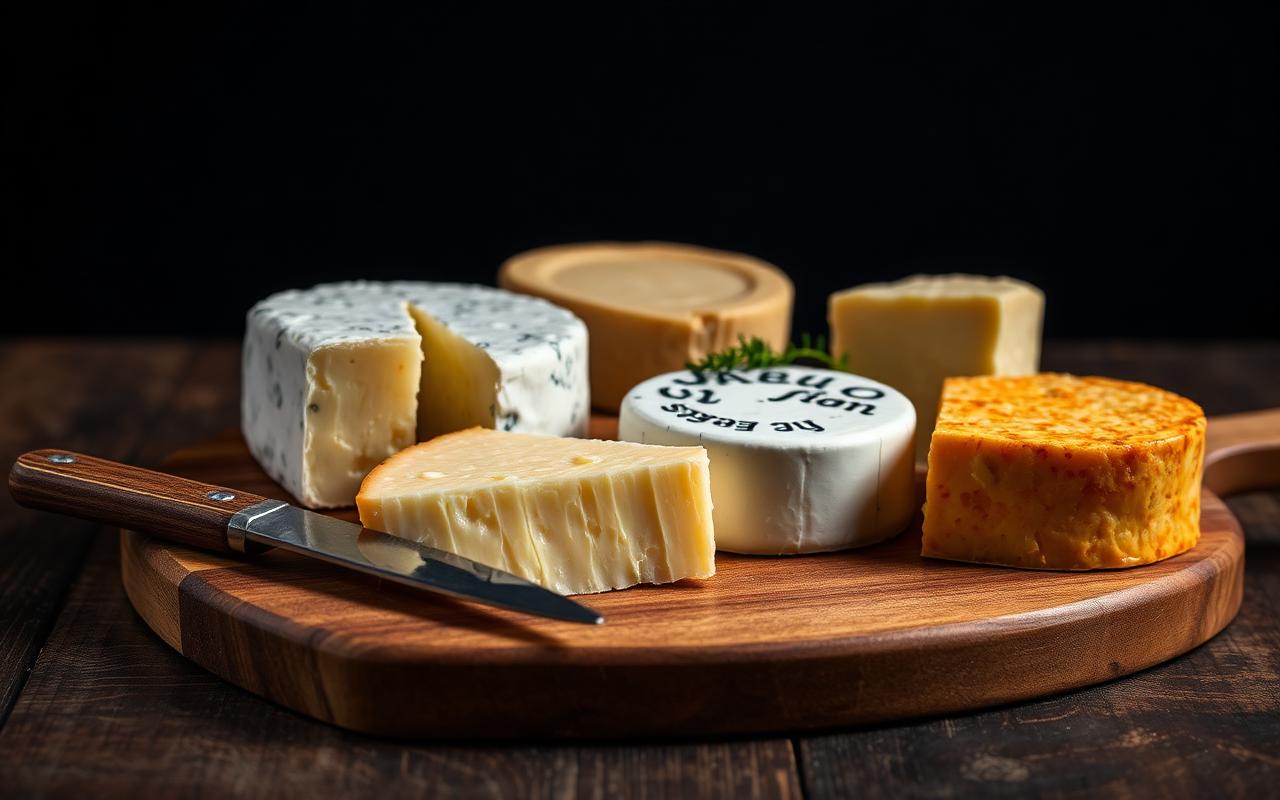
- IngredientsTop-Selling Cheeses in America: 2026 Foodservice RankingMarch 4, 2026 · 10 min read→
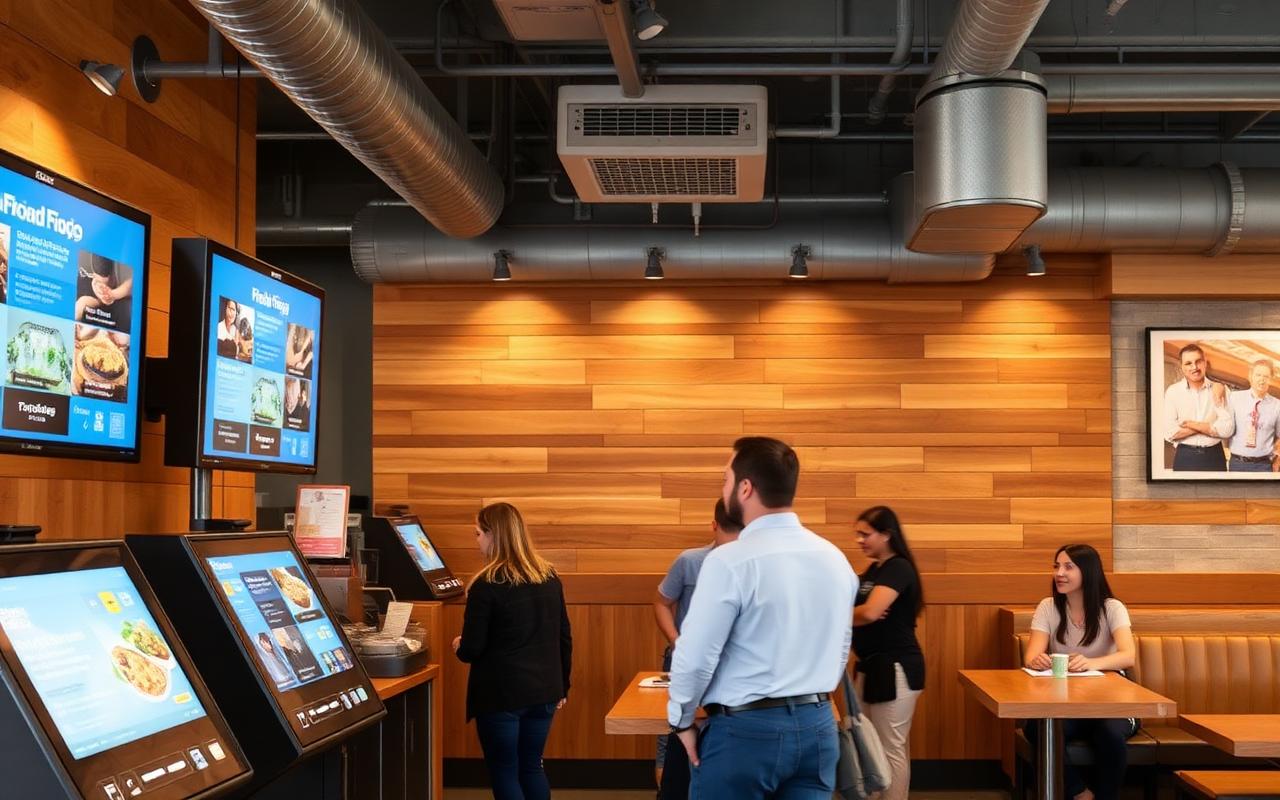
- Segment OutlookThe Future of Fast Casual: Five Forces Reshaping the SegmentJanuary 22, 2026 · 12 min read→
- Restaurant TechnologyRestaurant Technology in 2026: The Stack That Actually Pays BackFebruary 26, 2026 · 11 min read→
- OperationsMenu Engineering for Profitability in a 2026 Cost EnvironmentMarch 17, 2026 · 12 min read→
The 12 ingredients moving fastest on American menus
| Rank | Ingredient | Category | YoY menu growth | Penetration |
|---|---|---|---|---|
| 1 | Crunchy chili oil | Condiment | +142% | 14.8% |
| 2 | Hot honey | Condiment | +96% | 9.3% |
| 3 | Oaxaca cheese | Dairy | +187% | 1.8% |
| 4 | Yuzu kosho | Condiment | +78% | 2.1% |
| 5 | Smoked aioli | Condiment | +61% | 6.4% |
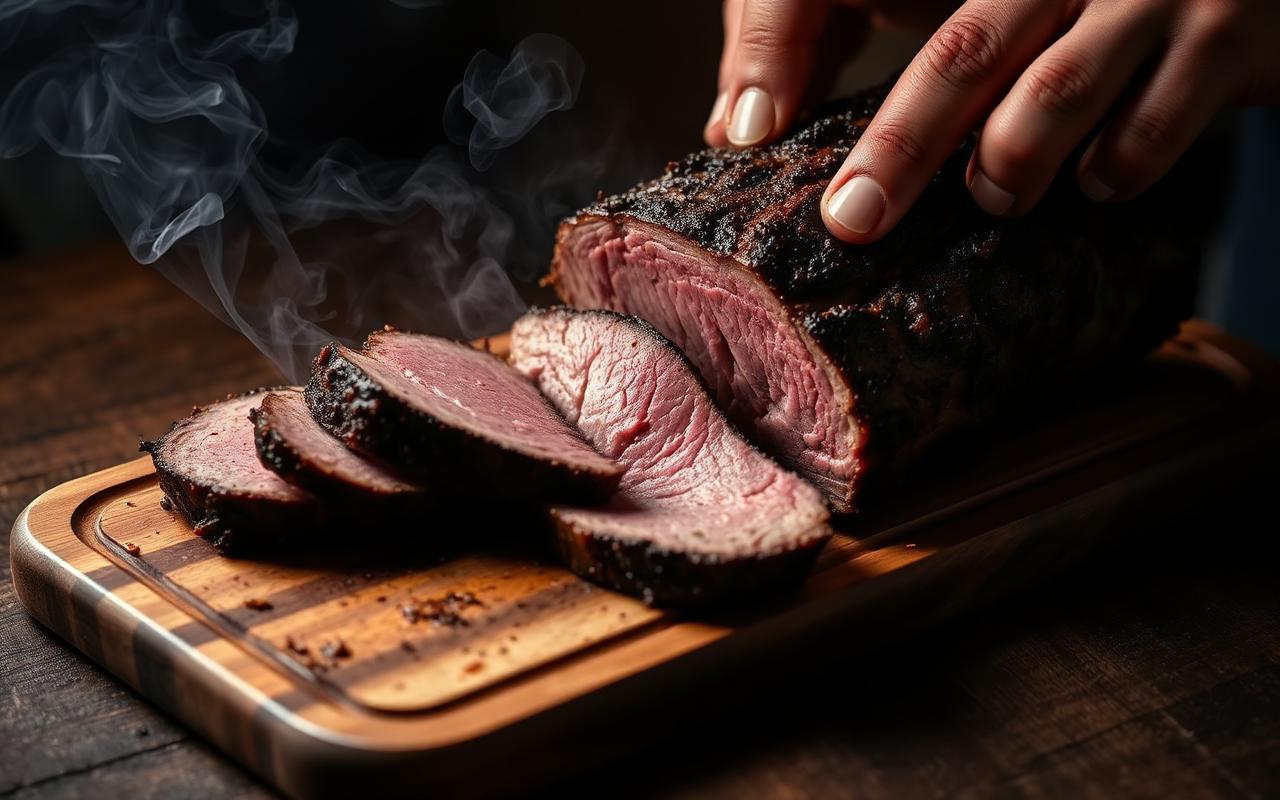
| 6 | Birria | Protein prep | +54% | 3.9% |
| 7 | Cold foam | Beverage | +44% | 11.2% |
| 8 | Calabrian chili | Pepper | +39% | 4.7% |
| 9 | Pecan-smoked bacon | Protein | +33% | 2.8% |
| 10 | Pickled shallots | Garnish | +31% | 5.5% |
| 11 | Salsa macha | Sauce | +29% | 2.0% |
| 12 | Black garlic | Aromatic | +22% | 1.4% |
A 12-minute monthly memo for the people deciding the cycle.
Every month, FSRI's research desk delivers a synthesized read on operator performance, supplier signals, consumer behavior shifts, and the two or three moves that will define the next 90 days.
- ▌Operator P&L benchmarks
- ▌Menu innovation index
- ▌Consumer sentiment shifts
- ▌Supplier and ingredient pricing
- ▌Three forward-looking analyst takes
Delivered the first Tuesday of every month. No advertising, no sponsored content.
By subscribing you agree to FSRI's privacy policy. We don't share subscriber lists.